


Hit or Miss
A Deep Dive into Aberdeen's Shooting Metrics

Another weekend, another abject Aberdeen defeat. The mix of emotions in one campaign, not even two thirds complete has been quite remarkable. From the hopefulness that finally the club was going in the right direction, the unabandoned joy of that 2-1 to remain joint-top and go nine points clear of second, to the utter hopelessness that was last Saturday.
I’ve forgone a ‘forensic’ analysis on the St. Mirren match. I’m not sure how many times you can say the same thing. Instead, I’ve tried to drill deeper into Aberdeen’s shot statistics to see if they can tell us anything about what can only be termed euphemistically as a ‘downturn in form’.
Contents
With some basic help from YouTube, I was able to pull every shot Aberdeen have taken in the 2024/25 SPFL Premiership from FotMob. I’m using FotMob as it’s the most accessible app and it’s free. There are different models, that present slightly different results, so this is by no means gospel. The only thing we’re looking at here is Aberdeen’s attacking data. I’m fully aware that this is a two-way street so I’ll try and get to the defending side at some point too.
Over/Under Performance
Shot accuracy and conversion
Chance Quality (xG)
Shot Quality (xGOT)
Player Contributions (xG and xGOT)
Actual Chances
Most of this data is presented without comment. As I’ve said before, I’m just a hobbyist with a keen interest. It’s more than possible I’m missing nuance and interpreting things incorrectly so I don’t want to draw any major conclusions, but I think some patterns can be identified that supports what we see on the pitch. If you see any issues, just let me know!
Over/Under Performance
It’s common knowledge that Aberdeen were over-performing relative to the ‘data’ in the opening 11 matches of the season. There’s been a suggestion that the team is now under-performing, but is that the case?
Again we bow to the xG Gods who are the ones who determine the expected points. I covered the start of the season back on December 14th. Although the barren run extends beyond this period, I’m going to use this period to contrast and compare for this post. The Dons, had, at that point, still only lost one game.
At that stage, the four providers I consulted had Aberdeen at the below after 16 games.
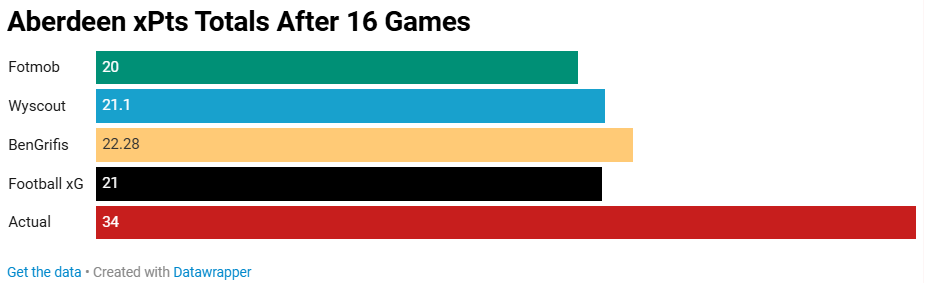
Here’s what they said Aberdeen should have gotten in the last eight games.
So, if we accept the over-performance in the first 16 games of the season, we have to acknowledge the under-performance in the last eight. 7pts to me seems a little generous, never mind 10. As a reminder those eight games were:
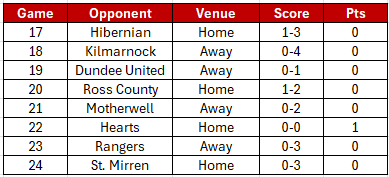
At a push I could make a case for Dundee Utd being a point and Ross County a win, but beyond that, it is pretty difficult. And that draw, against Hearts, was only courtesy of an injury-time penalty save.
However, I’m less interested in the unlucky/lucky, regression to the mean style debate, but more in really trying to use the data to see if we can make any further conclusions on the lack of goals in this period: One in open play, the other a jammy-free kick in the snow.
Shot Accuracy and Conversion
Let’s keep it simple to begin with and just look at shot data.
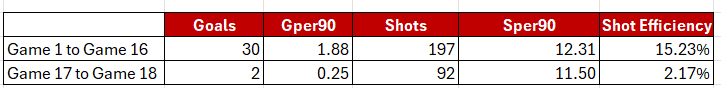
The first conclusion is that Aberdeen are taking fewer shots, but only marginally—not even one per game on average. What’s clear is that the efficiency of shots to goals is significantly lower.
In the Dundee Utd game recap, I looked at Aberdeen’s shot efficiency versus historical totals. So here’s first 16 games versus last eight, alongside historical averages (provided by Alan Morrison).
Important to note eight games is a small sample size and chopping off after 16 games is somewhat arbitrary. So just for context, here’s the first eight games, the middle eight games and last eight games.
We have a historical over-performance, a regression to the mean and now a historical under-performance. No matter how you slice and dice it, the last eight games have been grim and just based on numbers, taking no in-game context into account, it’s hard to see how Aberdeen won’t turn things around in the coming weeks even if they just maintain their current shot totals and distribution.
One theory I had before we move into 2010s style data was that more shots are being blocked. Maybe the Dons are looking to create the perfect goal with a cutback and teams are crowding the central part of the box? But there’s no real sign of that. In fact, the share of shots being blocked is down in the last eight games to 29.3% from 32.5%. Effectively the 10% drop in On-Target shots has moved to Off-Target.

Chance Quality (xG)
As we know shots in isolation can only provide a certain level of insight, so that’s where our friend xG can come in i.e. quality of chance being created. So first 16 games versus last eight.
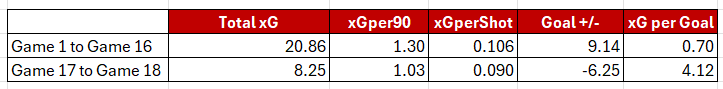
Just like the shot data, we’re seeing a decline in numbers but not enough to warrant such a scoring drought. From a quick internet search around 0.4xG is considered a ‘big chance’ so the Dons are maybe one decent opportunity down per game.
The current underperformance has now put Aberdeen close to the expected total. The regression to the mean is almost complete. But if we’re not too far off in the overall level of chance quality per game, certainly not enough to warrant such a significant drop-off, this must be a case of bad finishing?
Shot Quality (xGOT)
The closest metric we can use to measure the effectiveness of the shot after the chance is xGOT (expected goals on target). Now there is one flaw here. A shot that skims past the post will give you 0.0 xGOT but a trundler down the middle from 40 yards will, however small, give you some credit. So whether it is the complete barometer of finishing, is not really clear, but it does acknowledge the one true fact, aside from deflections, if you don’t get the ball on target, you don’t score.
And, well, there’s some proof in the pudding here.
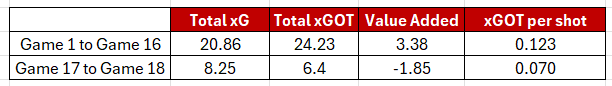
Does this answer our question? Perhaps not the whole picture but certainly provides some clues. The players getting on the end of chances are reducing the value of those chances with their finishes. Conversely at the start of the season and through the first 16 games, on average an additional 1.7% likelihood of a goal was being added. Now the chances of a goal from each chance are being reduced by 2% on average.
So who’s responsible?
Player Analysis
Ok, let me preface this by saying this is just the data, there will be more nuance involved, but this is what the numbers tell me.
First, if we just look at actual goals versus xG.
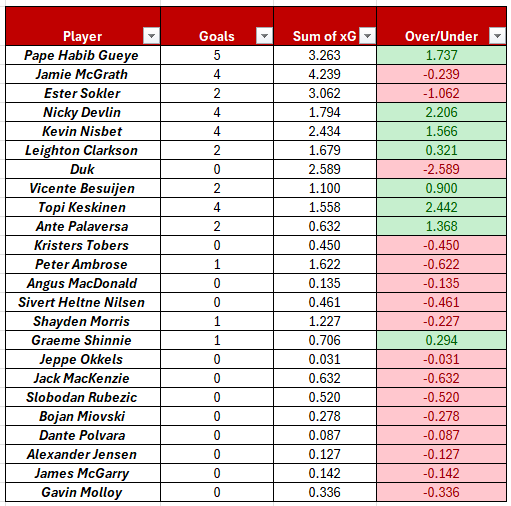
So the data above would therefore suggest that our top performers in front of goal have been Topi Keskinen, Nicky Devlin, Pape Gueye, Kevin Nisbet and Ante Palaversa, in that order.
Ultimately goals are what counts but attributing their success entirely on such a small sample size might be a little presumptive. For example, do we give Kevin Nisbet the credit for his goal against Ross County or do we attribute that to poor goalkeeping and freak weather conditions?
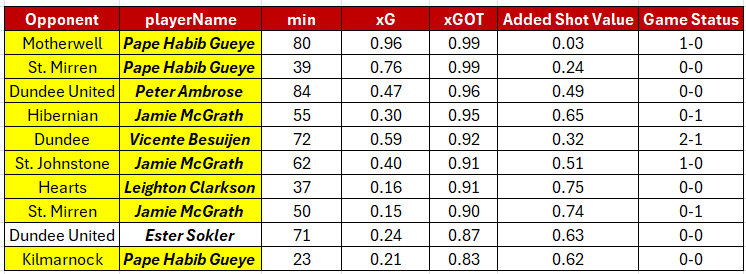
If we take a look at all every goalscoring chance and the subsequent xGOT added to the shot, it paints a slightly different picture.
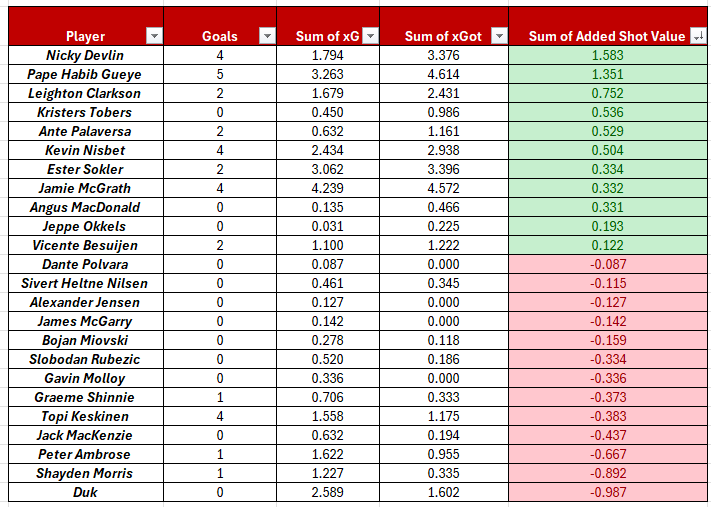
The conclusion here is we need Nicky Devlin more involved in attacking play and Pape Gueye 2.0 to return versus Pape Gueye 1.0.
Again, does this tell all the story? Maybe aye, maybe no. We also should consider the ability to generate positive xG by getting in the right positions to score. Is Duk having a really bad season or just bad luck?
In his book xGenius, James Tippet states: “There is an inherent skill involved with attaining xG, whereas the converting of that xG is more down to chance.” To illustrate this point he shows that Cristiano Ronaldo ‘ underperformed xG in six of the final eight seasons he spent competing in the top five European leagues. Despite scoring a whopping 186 goals over this period, his shooting opportunities amassed to 192.36(xG).’
For a reference closer to home, Miovski accumulated 17.08 xG to get his 16 goals last season but that also illustrates another point. Even with over-under performance, Sokler, Nisbet and Duk’s xG numbers remain pretty low. I think having a consistent #9 moving forward may help.
Actual Chances
What are our players doing with the actual chances we’re creating, when did they occur and who missed it? Here’s the ‘top’ 20 chances of the last eight games by xG.
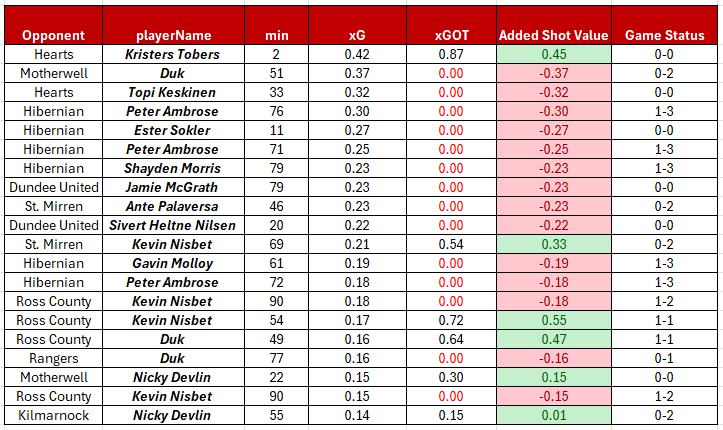
Now we’re maybe getting somewhere. As you can see from the above, from the best chances that are being created, the majority are missing the target (14 out of 20).
Aside from this sad tale, there are two additional questions that arise here:
Are the chances only being created because teams are sitting deeper and inviting pressure?
Possibly. We can see Motherwell and Hibs in there when both had two goal leads. It’s noticeable there are only four of the top 20 from the first half of games which could be a symptom of a bigger problem.
If any of these chances had been taken, would it have impacted the final result?
Again possibly. Certainly in the Hearts game, an early goal from the Tobers or Keskinen would have changed the nature of the match. Likewise maybe a goal 20 mins from time against Hibs could have led to an equaliser. Motherwell? Not sure.
If you compare this to the top 20 from the first 16 games, it’s a very different picture, albeit this is a bigger sample size. Cells highlighted yellow represent a goal.
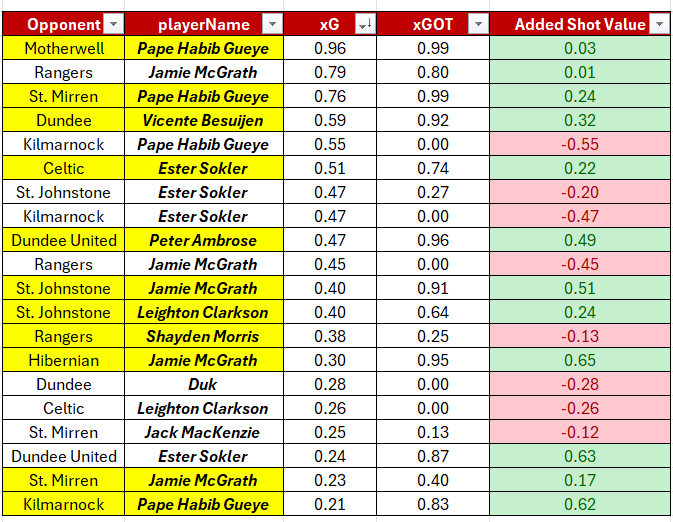
We can conclude that earlier in the season that the shots from the best chances earlier in the season, were more likely to result in a shot on goal.
Bad Luck?
Here’s the top 10 ranked chances of the last eight games by likelihood to be a goal, via the post-shot xG.
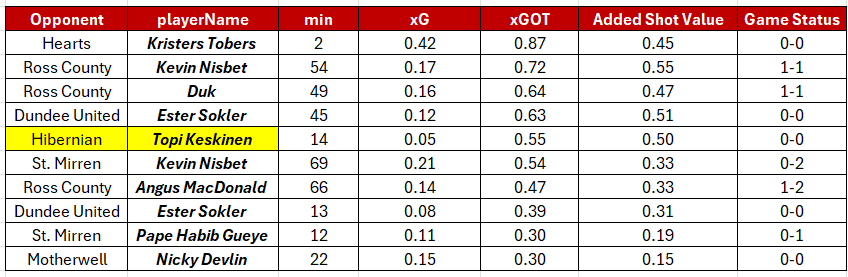
There’s some duplication here but we can also conclude that maybe Aberdeen have come up against some inspired goalkeeping in a couple of games. Ross County is the prime example.
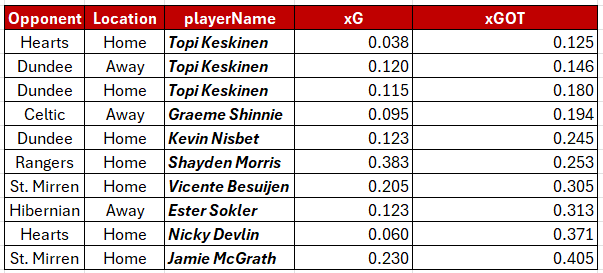
Here’s the comparison with the first 16 games. Again, yellow - goal.
As we’ve shown, this early season run was quite unprecedented in terms of the goals scored from the number of shots generated as well as the expected goals. The above shows some good chances being created and some really good finishes being applied.
For more understanding, it’s probably worth considering the ten goals that did go in with the lowest xGOT probability. This might give us more of an indication on the luck that was at play in the earlier part of the season, perhaps some poor goalkeeping assisted us in these occasions? Topi’s not complaining.
Summary
To conclude the findings of this analysis of Aberdeen’s shot event data over the last eight games in comparison with the first 16 games identifies the following:
A slight decrease in the average number of shots per game from 12.31 to 11.5
A noticeable decrease in shot accuracy from 35% on-target to 25% on-target.
A major decrease in on-target shot conversion (e.g. shots on target that lead to goals), not only in relation to the start of the season but also in comparison to historical SPFL averages
A decrease in xG per game from 1.30 per 90 to 1.03
A significant decrease in xGOT which suggests a decline in finishing quality in the box.
An indication that lower quality finishes were going in at the start of the season
Looking ahead, the good news is that Aberdeen have been able to generate good chances against Hibernian this season. The bad news is at the other end of the pitch. But you knew that already. When I’m ready and have time, we will take a look at the defensive side of the ball.
Enjoy tomorrow’s game, if you can.
COYR