


Dons Data #3: PPDA
Passes per defensive action e.g. the High Press

This is the third in a small series of posts that look at analytics metrics. The goal of this site is to try and make sense of what’s happening on the field. There’s a ton of football data out there today and a lot that is pretty hard to understand.
Such metrics can help to support or the eye test, make us reassess our initial impressions and give clues to predict future outcomes. These posts will provide a simple introduction and explore each one in greater detail using Aberdeen as a framework . They’ll be available as a glossary if referenced in future game debriefs or previews.
It’s hard to listen to the radio or read an article on Aberdeen FC or Jimmy Thelin without hearing mention of the Dons high pressing. It’s something we were promised.
For my money we’ve definitely seen some great examples of Aberdeen pressing high up the field and there have also been some games, or periods within games when they have dropped off and shuttled across the field, allowing the opponent the time to build-up or not, as the case may be. One simple difficulty in executing a high press is if the opponent does not want to retain possession in their own half of the field and this happens quite a lot in Scottish football. Alas, I digress.
One of the main metrics used to measure the intensity of a high press, and one I referenced last week in the Celtic recap is Passes per Defensive Action (PPDA). You can find a full explainer at that link but I’’ll summarise as best as I can.
PPDA = Number of Passes made by Attacking Team / Number of Defensive Actions.
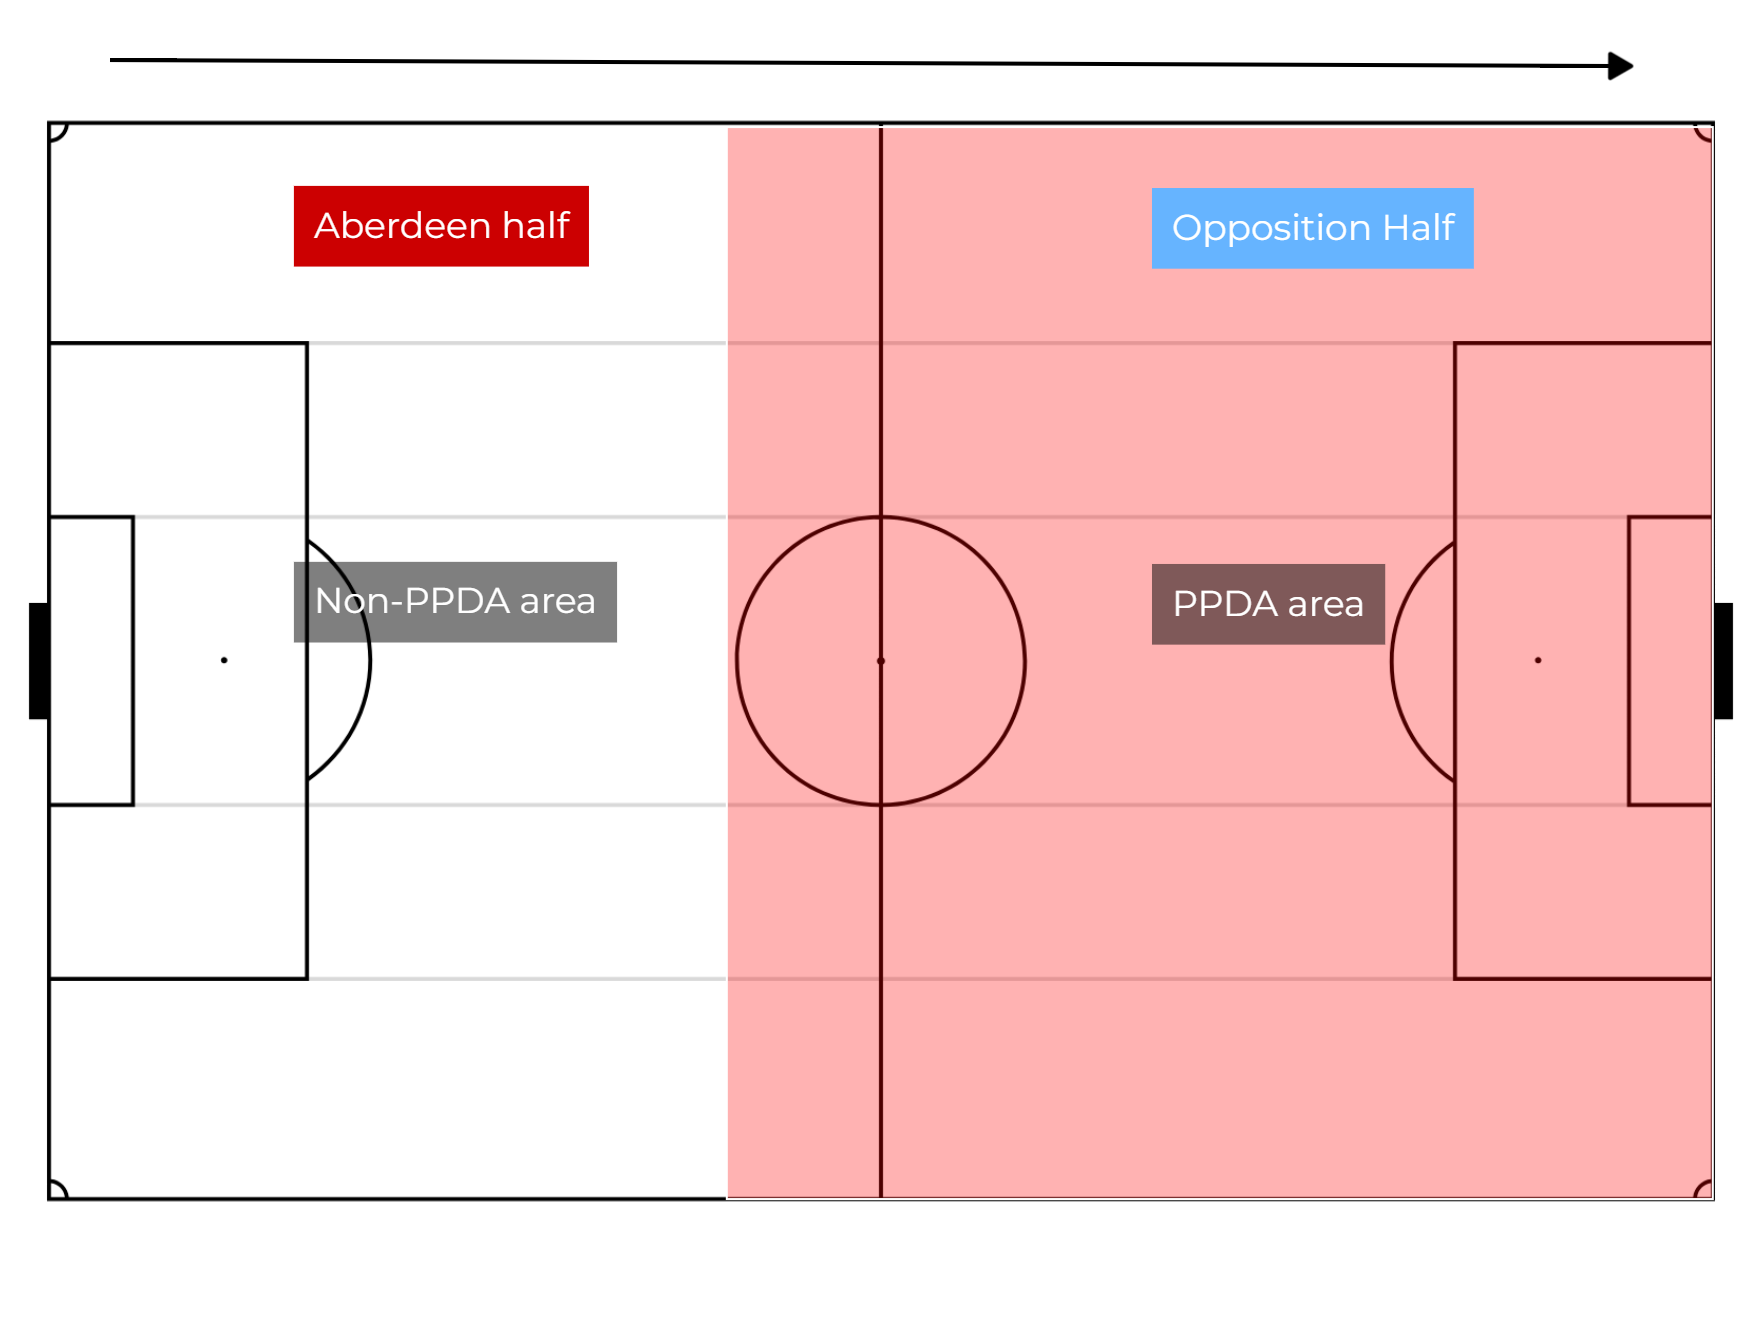
Crucially it only uses data which occurs in a certain area of the field which is determined as approximately the 60% of the pitch in the side you are attacking. Basically the opponents half to the top of the circle on your side. Graphic below.
A defensive action is considered as the following:
Tackles
Interceptions
Challenges (failed tackles)
Fouls
The lower the score the more intense the press is seen to be. You can visualise this from last Saturday’s game. In the first half, we let Celtic knock the ball around their back four so they completed a lot of passes before we engaged, or they played a pass beyond the PPDA area. In the second half things were a bit more intense (at least to begin with) and Aberdeen made it harder for Celtic to complete passes.
One slight issue, I would say is that PPDA doesn’t seem to measure if the ball is just kicked long. So, in Aberdeen’s opening goal, it was an intense press that led to Valle clearing it long but of course, Aberdeen didn't win the ball back until it arrived in their own half.
But, for now, it’s the best we’ve got, or at least, I’ve got access to and since it’s been considered such a high part of Jimmy’s game model, we should take a look at it.
League Rankings
All data here is taken from Ben Griffis match report app. He publishes a lot of data on all SPFL games (and pretty much any league you’d want to know about). The data is sourced from OPTA.

The Dons currently rank in fifth spot. I believe they have dropped a couple of positions after the game against Celtic. So perhaps not as high as may have been thought, but still comfortably one of the highest pressing teams in the league. Unfortunately, I don’t have any access to historical data to compare the current team to those of the past.
These rankings probably flag up more intersting points on the other teams in the league but perhaps may be skewed by the fixture list thus far.
Game by Game
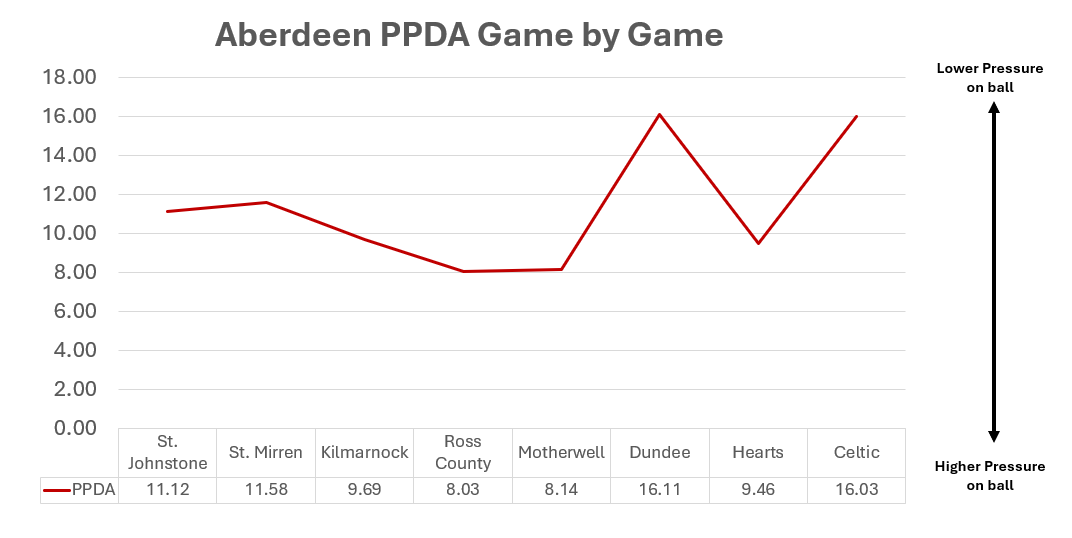
Again it's early in the season so lots of time to go to get a better picture but we can see a wide variation in Aberdeen’s number with the major outliers being the the Dundee and Celtic games.
The former, I feel might be related to the number of longer balls Clark Robertson played. The latter, down to the incredible number of passes Celtic completed and Aberdeen’s approach, particularly in the latter stages of games.
Conclusion
Using this metric, I think we can say Aberdeen are one of the more intense pressing teams in the league but there’s still a lot of variability within that. Additionally, there is nothing here that suggests there is something revolutionary happen. The Dons sit pretty much where you’d think they would sit.
There are other metrics we can look at to get a more rounded picture e.g. High Recoveries but we’ll take it like Jimmy, game by game and week by week. At least when this is referenced in the future, you’ll understand what it means.