


Dons Data #1: Expected Goals (xG)
How are Aberdeen faring?

This is the first in a small series of posts that look at analytics metrics. The goal of this site is to try and make sense of what’s happening on the field. There’s a ton of football data out there today and a lot that is pretty hard to understand. Such metrics can help to support or the eye test, make us reassess our initial impressions and give clues to predict future outcomes. These posts will provide a simple introduction and explore each one in greater detail using Aberdeen as a framework . They’ll be available as a glossary if referenced in future game debriefs or previews.
This week we will start with the most well-known and the poster child for analytics - Expected Goals.
What is xG
Expected Goals (xG) entered the mainstream a number of years ago and most people are aware of the general concept. Essentially it is an indicator of chance quality and by extension a tally of how many chances a team is creating. Each chance is assigned a value between 0 and 1 using the final shot position. Using the Dons as an example: Pape Gueye’s header against St. Mirren had an xG value of 0.76. The second header against Kilmarnock had an xG value of 0.07. Penalties are consistently 0.79. 79% of the time they should be scored.
xG has been shown to be a fairly good predictor of long term performance. Though spikes happen up or down, teams in general tend to regress to the mean over time.
Aberdeen xG so far this season
It’s hard to look for negatives in Aberdeen’s campaign so far but the one area that might be of concern is the Dons xG.
I’ve primarily used the data freely available from FotMob. There are variances via different systems, so sometimes the data may not correlate exactly in different publications, but for the most part they tend to tell a similar story.
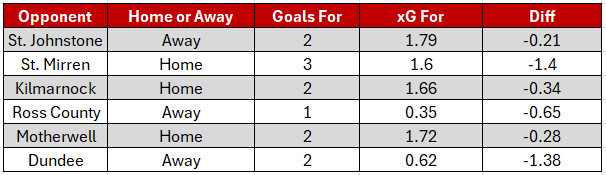
What the data is telling us right now is that Aberdeen are outperforming their xG. The Dons have a cumulative xG of 7.7 but have scored 12 goals. Here’s it broken down game by game.
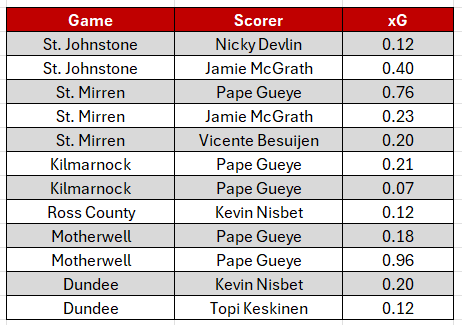
And here’s it broken down goal by goal.
What does this mean?
Right now, the sample size is very small but it is a slight cause for concern in terms of maintaining Aberdeen’s momentum long-term. This is unlikely to be sustainable. At the moment, the team is not creating as many chances as we might want.
This should be caveated to some degree as the Dons have led in all six games. They have had less need to push forward and create chances for the full 90 minutes and the gameplan has adjusted.
It is also highly possible for teams to ride these streaks for an extended period of time, so there’s no guarantee things will change quickly. Lawrence Shankland for example, but scored 24 goals in the league last season from an xG of 17.1.
And, as the article linked above notes, Aberdeen do not now have to underperform for the rest of the season to return to their expected totals. They’ve banked that overperformance to give us this exceptional start. Going forward, the xG and actual just might get a little closer.
We also have to consider the gradual element of Thelin building his team. Developing refined attacking systems, patterns and principles can take a bit longer than create a solid backline.
In light of which, next week, we’ll take a look at the numbers for xGA (expected goals against). This tells a rosier picture for us all.